Paths Through the Genome: Graph Theory for Sequence Assembly
Illumina’s HiSeq X Ten System allows you to sequence the entire 6.4 billion base pair human genome for only $1000 – but in chunks of just 150 base pairs at a time. Sequence assembly is the jigsaw puzzle of assembling millions of chunks of DNA sequence back into an ordered genome. Graphs are called upon to address this challenge. The applications of graph theory to genome assembly are growing with the introduction of graph genomes to mitigate reference genome bias.
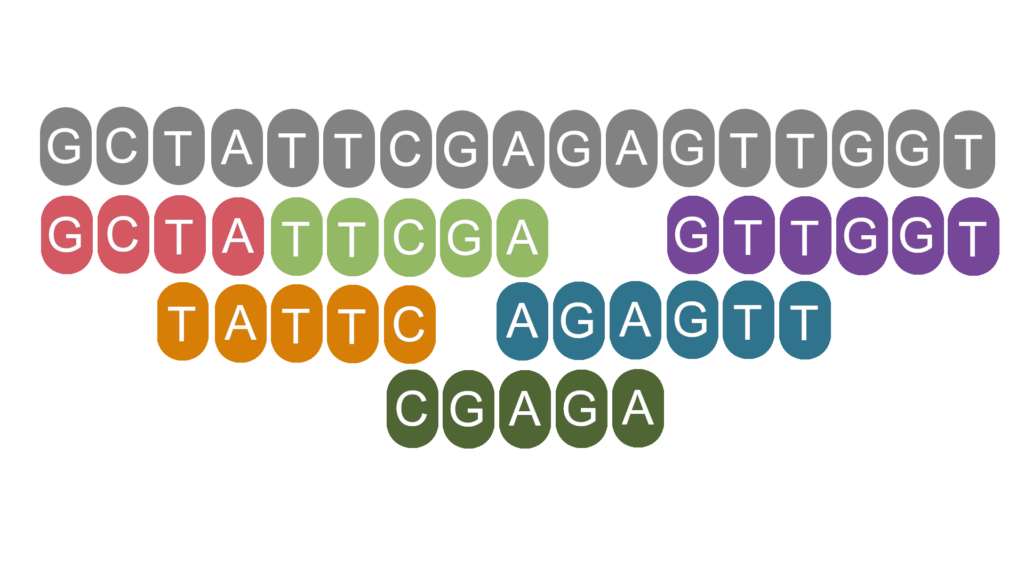
Sequencing an organism’s genome opens up a world of opportunity for exploring that species’ evolution, biology, and health. Genome sequencing was first performed with Sanger sequencing, which ‘reads’ moderate sized chunks of DNA (Figure 1). These reads must then be reassembled into the organism’s genome. If you’re sequencing the first individual of a species, this is like trying to putting together a jigsaw without even knowing what image you are trying to create.
To identify which ‘pieces’ go together, parts of one read that overlap with parts of other reads are identified. Algorithms that exploit the principles of graph theory are then employed to use these overlaps to identify how reads are ordered in the genome.

Figure 1 | Grey nucleotides represent an example true sequence of DNA. The coloured nucleotides represent 6 reads obtained when this DNA was sequenced. Sequences are much shorter than in reality for illustrative purposes.
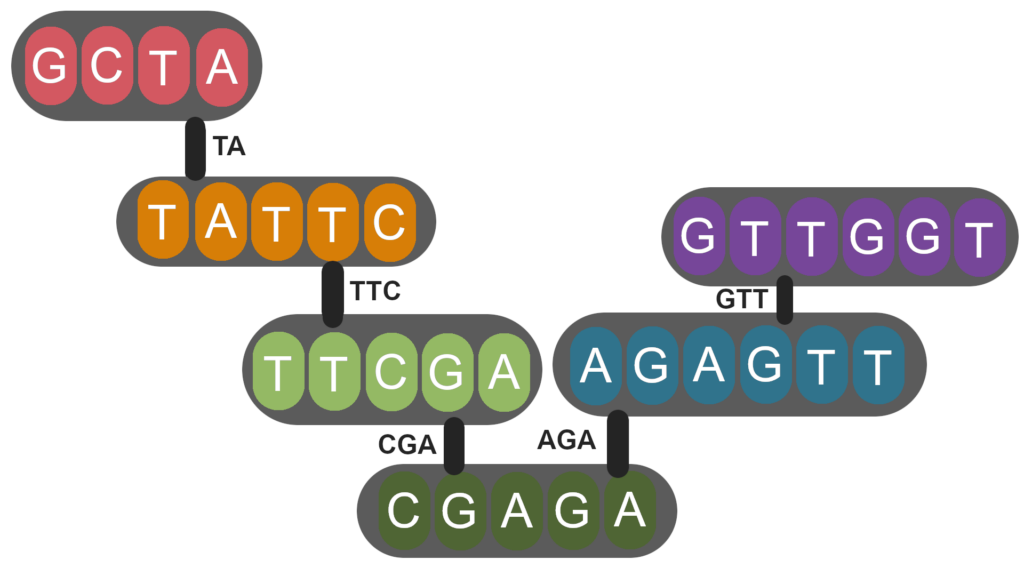
In mathematics, graphs are composed of vertices connected by edges. We can imagine trying to find the sequence of the genome by viewing each read as a vertex. An edge exists between two vertices if they contain overlapping sequence (Figure 2). To find the order of the reads in the genome, we find the path that visits each vertex once. This is called the Hamiltonian path and is easy to solve when the overlapping sequences are unique. However, when we encounter repeats, a single vertex may have multiple edges, and the Hamiltonian path becomes more difficult to determine. For this reason, repeat regions are usually unresolved when sequence assembly is performed by such an overlap-layout consensus method.

Figure 2 | Each node (grey ellipse) is a read which is connected to other reads by edges (black bars) which represent overlapping sequences.
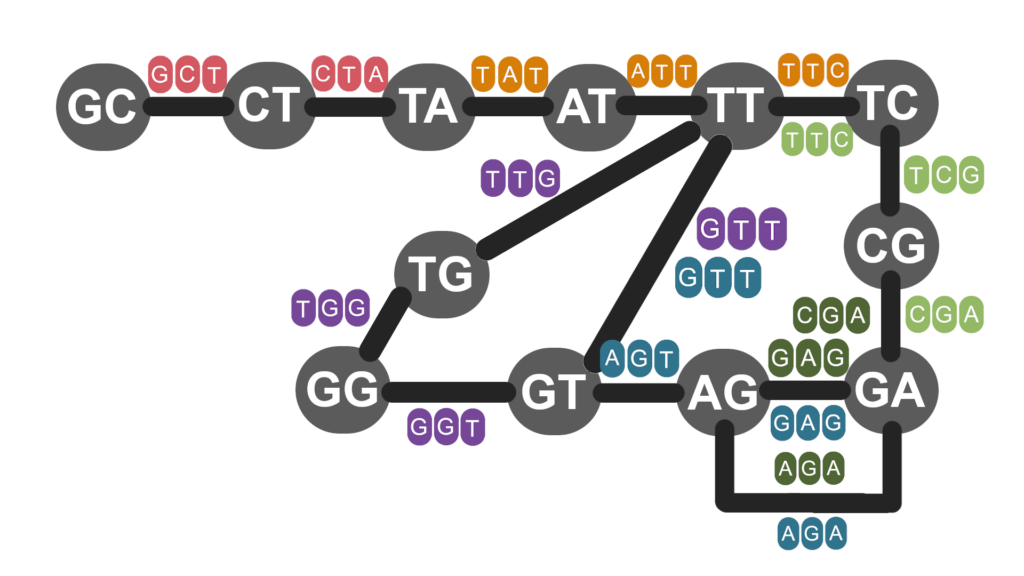
Sanger sequencing was superseded by second generation sequencing platforms, like the Illumina HiSeq, that provide greater speeds and lower costs, at the price of shorter read lengths. Shorter read lengths make resolving repetitive regions even more difficult. The de Bruijn graph (DBG) assembly method was developed to improve assembly of short read data (Pevzner, Tang & Waterman, 2001). Perhaps surprisingly, DBG begins by dividing the reads up into even shorter sequences of length k, called k-mers. Every k-mer has a left and a right (k – 1)-mer (Figure 3). The (k – 1)-mers are the vertices in the de Bruijn graph, and the edges are the k-mers they exist in. Instead of visiting each vertex once, as we did in overlap-layout consensus, we visit each edge once. This is known as an Eulerian path and is easier to solve than the Hamilton path.

Figure 3 | Each node (grey circle) is a (k - 1)-mer which is connected to others by edges (black bars) which represent k-mers obtained from reads.
The pendulum is now swinging back towards long read methods. Biotech companies such as PacBio and Oxford Nanopore have developed third generation technologies that produce reads up to 200,000 bp in length. Long reads eliminate the problem created by repetitive regions simply by exceeding them in size. This give us greater certainty in our genome assemblies.
After the initial sequencing of a species, assemblies of other individuals of that species are made easier by aligning them to previously sequenced (reference) genomes. However, when we sequence new individuals, it is often because we are interested in how their genome differs from others of their species. By performing alignment based on a reference genome, we are more likely to discard or misalign reads that contain structural genetic variation not shared by the reference. Thus, the use of reference genomes has the potential to introduce bias into genome assembly.
Instead of viewing our reference genomes as linear sequences, we can view them as graphs (Paten et al., 2017). This means that there is no single ‘correct’ path through the genome: the graph acknowledges and encodes possible variation through the addition of edges and vertices. This improves assembly accuracy and variant calling. Thus, graphs and path finding algorithms are not only fundamental aspects of sequence assembly, but continue to provide new avenues for advancements in genome sequencing.
This blog post was inspired by the genomic approaches workshop put on by EASTBIO. Many thanks to the contributors for providing this training.
References
Paten, B. et al. (2017) ‘Genome graphs and the evolution of genome inference’, Genome Research. Cold Spring Harbor Laboratory Press, pp. 665–676. doi: 10.1101/gr.214155.116.
Pevzner, P. A., Tang, H. and Waterman, M. S. (2001) ‘An Eulerian path approach to DNA fragment assembly’, Proceedings of the National Academy of Sciences of the United States of America. National Academy of Sciences, 98(17), pp. 9748–9753. doi: 10.1073/pnas.171285098.
Prendergast, J.; Talenti, A.; Wragg, D. & Riggio, R. ‘Genomic Approaches’, EASTBIO Foundation Masterclass, 24th April 2020.